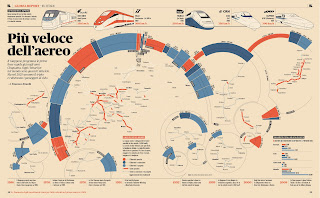


just some of the info graphics i came across while searching the web that i found particularly awesome. i dont know how many we had to post but i hope this is enough. (for those who cant read italian, in the first one theyre basically talking about different brands of transportation)
i also found another blog called the best part...it has some pretty interesting design stuff (and other things too)
also, my five pillars of information are:
1. entertainment (facebook, music, movies, 'family time')
2. travel (mileage, elevator rides, modes)
3. food (breakdown of carbs vs proteins and stuff, how long it takes me to eat/cook)
4. necessities (sleep and shower average times, class time, work time and what it's produced)
5. eccentricities and addictions (coffee/tea count, number of sticky notes written, snooze button smacks, impulsive purchases, number of pamphlets collected)
..et cetera.
for all of the categories i will be displaying the weekly and daily averages. i've decided to focus more on what i did in time, rather than just time. though time will still have it's place in the project, i think its more interesting to point out what happened during that time, and why i choose to do it.
also, i thought this was kind of awesome

Are Batman and Robin running away, or towards us?
ReplyDeleteWay more than kinda awesome.
Gorgeous graphic findings.